
Self Storage Google Ads Statistics: What Drives Move Ins
StorIQ analyzes more than $1 million in keyword spend across hundreds of managed self storage campaigns to identify how keyword themes and match types relate to tracked move ins.

John Reinesch
Founder, StorIQ

On This Page
- Headline findings
- How StorIQ defines cost per move in
- Keyword theme statistics
- Brand efficiency requires an incrementality caution
- Geographic keywords led the major nonbrand themes
- Near me delivered volume at a higher cost
- Generic and storage type terms showed budget mismatch
- Match type statistics
- Theme and match type matrix
- What the research can and cannot say about proximity
- A budget reallocation decision framework
- Attribution quality determines how useful CPMI can be
- Methodology and limitations
- Data scope
- Outcome measure
- Exclusions
- Keyword classification
- Relative statistics
- Observational design
- Geographic limitations
- What operators should take from the data
- Sources
More clicks do not necessarily mean more tenants. To examine which paid search choices were associated with tracked rental outcomes, StorIQ reviewed more than $1 million in keyword spend across hundreds of managed self storage campaigns.
The useful question is not which keyword attracts the most clicks. It is which searches become renters at a sustainable acquisition cost. The data shows meaningful differences in keyword intent, match type and budget allocation.
Research note: These are observational findings from a selected managed portfolio, not industry averages or guaranteed savings. Detailed account and tenant sample counts are not published. Conversion definitions varied, and some comparisons excluded campaigns without recorded move ins. Full limitations appear below.
Headline findings
- Geographic keywords had the lowest observed cost per move in among the major nonbrand themes.
- Near me searches delivered about 31% of tracked move ins, although their cost per move in was about 51% higher than geographic terms.
- Generic keywords received 29% of keyword spend but generated 21% of tracked move ins.
- Exact match was the most efficient match type in the pooled nonbrand comparison. Broad was 35% above exact, while phrase was 42% above exact.
- Storage type terms received 9% of spend and produced 5% of tracked move ins, but specialty inventory and tenant value can change their economics.
For broader campaign planning context, see StorIQ’s guides to self storage Google Ads and self storage PPC.
How StorIQ defines cost per move in
Cost per move in, or CPMI, was calculated as:
Google Ads spend divided by tracked move ins
This metric moves the analysis beyond clicks, calls, forms, and reservations. Those interactions can be useful diagnostic signals, but they do not always become tenants.
Tracked move ins in the supplied research included recorded rental conversion actions such as online rentals and attributed phone rental actions. Because account configurations varied, CPMI should not be read as a uniformly verified cost for incremental tenants.
StorIQ explains the metric in more detail in its guide to Google Ads cost per move in.
Keyword theme statistics
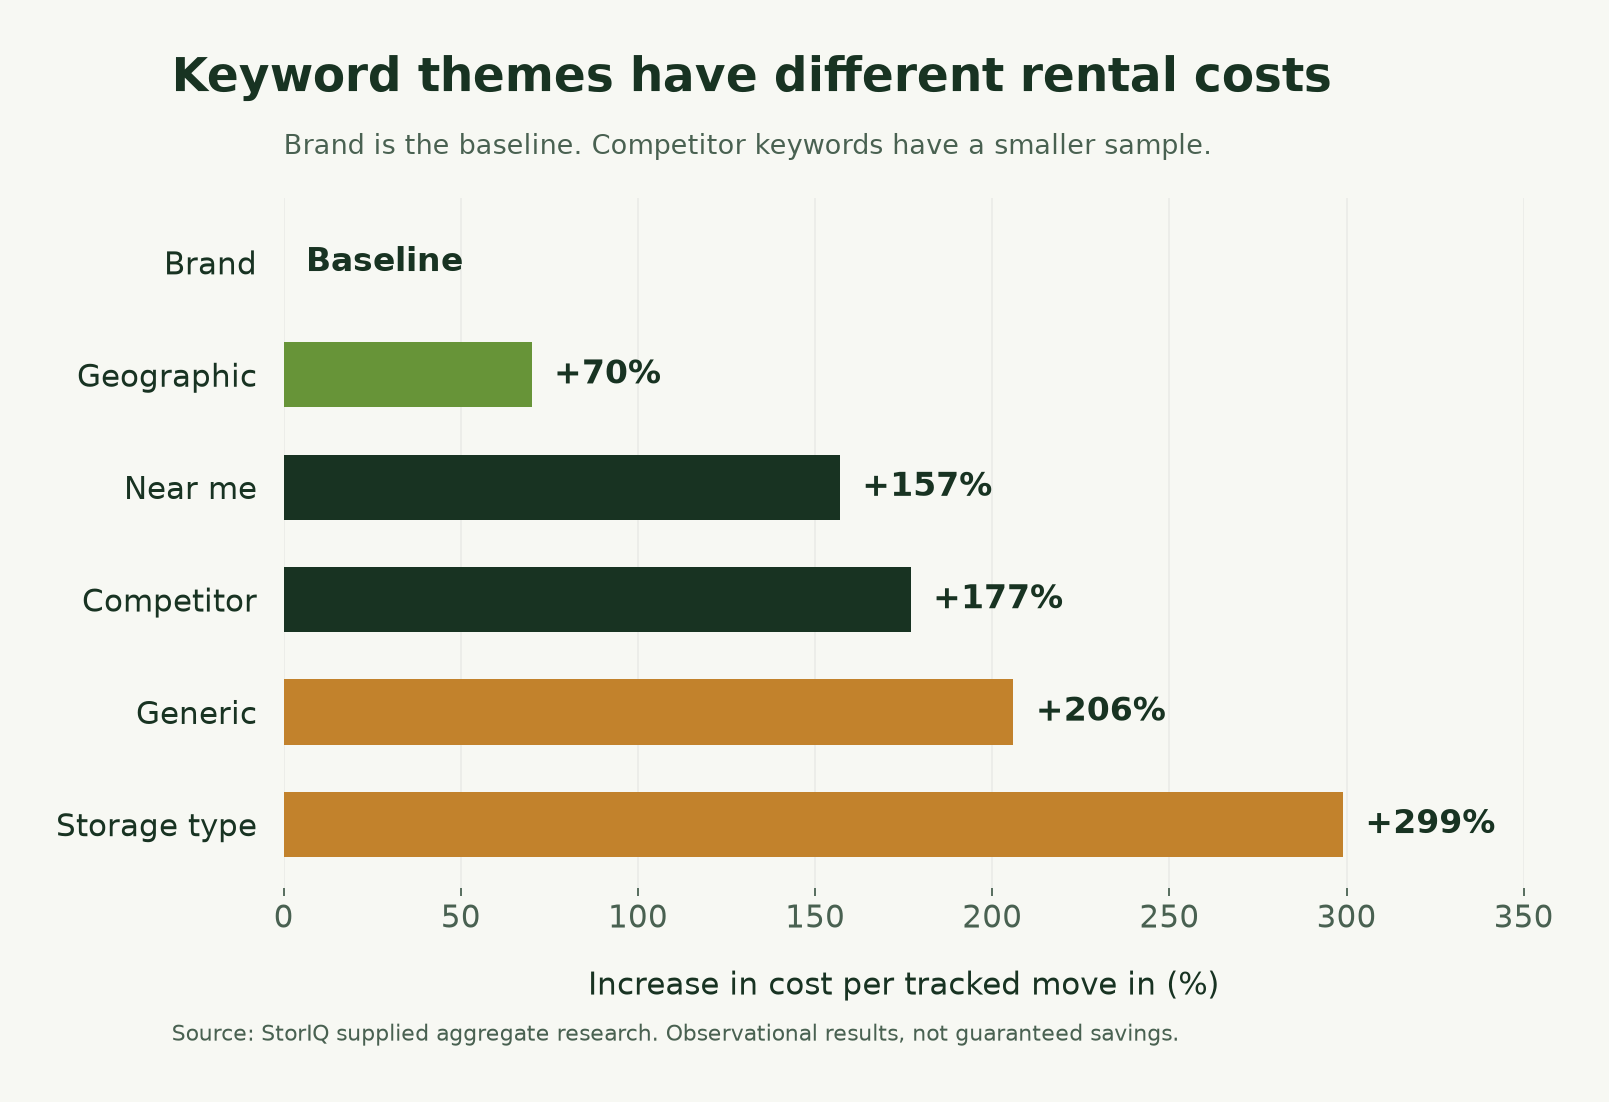
The analysis grouped keywords into brand, geographic, near me, competitor, generic, and storage type themes. Brand was indexed at 100 so the portfolio could be compared without publishing account specific CPMI amounts.
| Keyword theme | CPMI index | Difference from brand |
|---|---|---|
| Brand | 100 | Baseline |
| Geographic | 170 | 70% higher |
| Near me | 257 | 157% higher |
| Competitor | 277 | 177% higher |
| Generic | 306 | 206% higher |
| Storage type | 399 | 299% higher |
A 299% increase means storage type CPMI was about four times the brand baseline, not three times the baseline. Competitor results came from a smaller sample and should be treated as descriptive rather than a stable planning benchmark.
Brand efficiency requires an incrementality caution
Brand keywords had the lowest recorded CPMI. That is expected because a person searching for a facility or operator by name may already know the business and may already be close to renting.
A low brand CPMI does not prove that every tracked move in was created by the ad. Some searchers might otherwise have reached the facility through an organic listing, a map result, a direct visit, or another channel.
Brand and nonbrand acquisition should therefore be reported separately. Brand campaigns can protect paid visibility, but their observed efficiency should not be presented as proof of incremental demand.
Geographic keywords led the major nonbrand themes
Geographic keywords included searches containing a city, town, neighborhood, or other local modifier. Their indexed CPMI was 170, compared with 257 for near me and 306 for generic terms.
Based on those index values:
- Geographic CPMI was about 34% cheaper than near me CPMI.
- Geographic CPMI was about 44% cheaper than generic CPMI.
- Near me CPMI was about 51% higher than geographic CPMI.
- Generic CPMI was 80% higher than geographic CPMI.
- Storage type CPMI was about 135% higher than geographic CPMI.
These results make geographic coverage a useful starting point for nonbrand account reviews. Operators can compare campaign coverage with relevant cities, neighborhoods, and market names, then use facility data rather than generic keyword volume to decide where expansion is justified. StorIQ’s self storage SEO keyword guide provides additional context on local search language, although organic and paid outcomes should be measured separately.
Near me delivered volume at a higher cost
Near me keywords accounted for about 31% of tracked move ins. That makes them an important source of observed rental volume even though their CPMI was higher than the geographic theme.
The practical tradeoff is efficiency versus available demand. Removing near me terms solely because their average CPMI is higher could reduce move in volume. Giving them unlimited budget could also crowd out geographic terms with stronger observed efficiency.
A more disciplined review asks:
- How much tracked move in volume does near me produce?
- How does its CPMI compare with geographic terms in the same facility and market?
- Does performance change by match type, inventory position, or targeted area?
- Is additional volume worth the added acquisition cost?
Near me should be evaluated as a substantial demand source, not automatically labeled either essential or wasteful.
Generic and storage type terms showed budget mismatch
Generic searches included broad concepts such as self storage, storage unit, and storage units without a geographic modifier. Storage type searches included specialty needs such as climate controlled, vehicle, boat, or RV storage.
| Keyword theme | Share of keyword spend | Share of tracked move ins |
|---|---|---|
| Generic | 29% | 21% |
| Storage type | 9% | 5% |
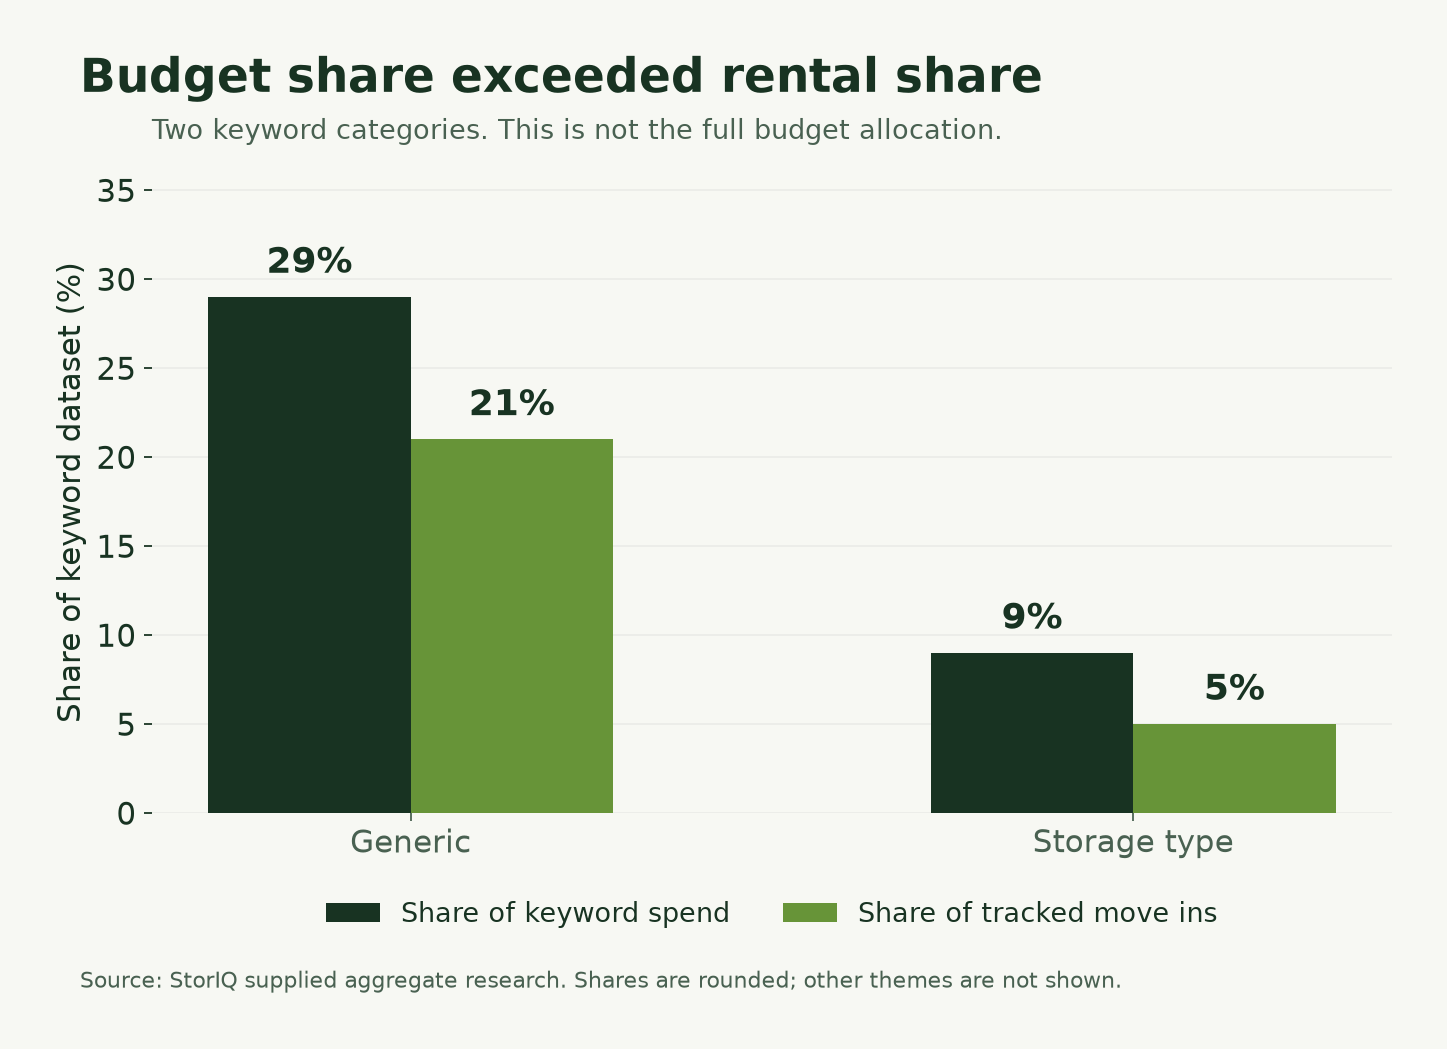
Generic keywords consumed a larger share of spend than of tracked move ins. Their CPMI index of 306 was 80% above the geographic index of 170.
That does not make every generic term unprofitable. Generic searches can add volume where local keyword demand is limited. The mismatch does mean they deserve closer review before receiving a dominant share of budget.
Storage type terms had the highest observed CPMI among the major themes. Their index of 399 was about 135% above geographic terms and about four times the brand baseline.
The specialty result requires operational context. A facility with scarce RV, boat, vehicle, or climate controlled inventory may value those tenants differently. A higher acquisition cost can still be acceptable when the facility offers the requested product and the expected tenant economics support the spend.
The finding supports selectivity, not automatic exclusion. Specialty terms should be connected to available inventory, market demand, pricing, and tracked rental value.
Match type statistics
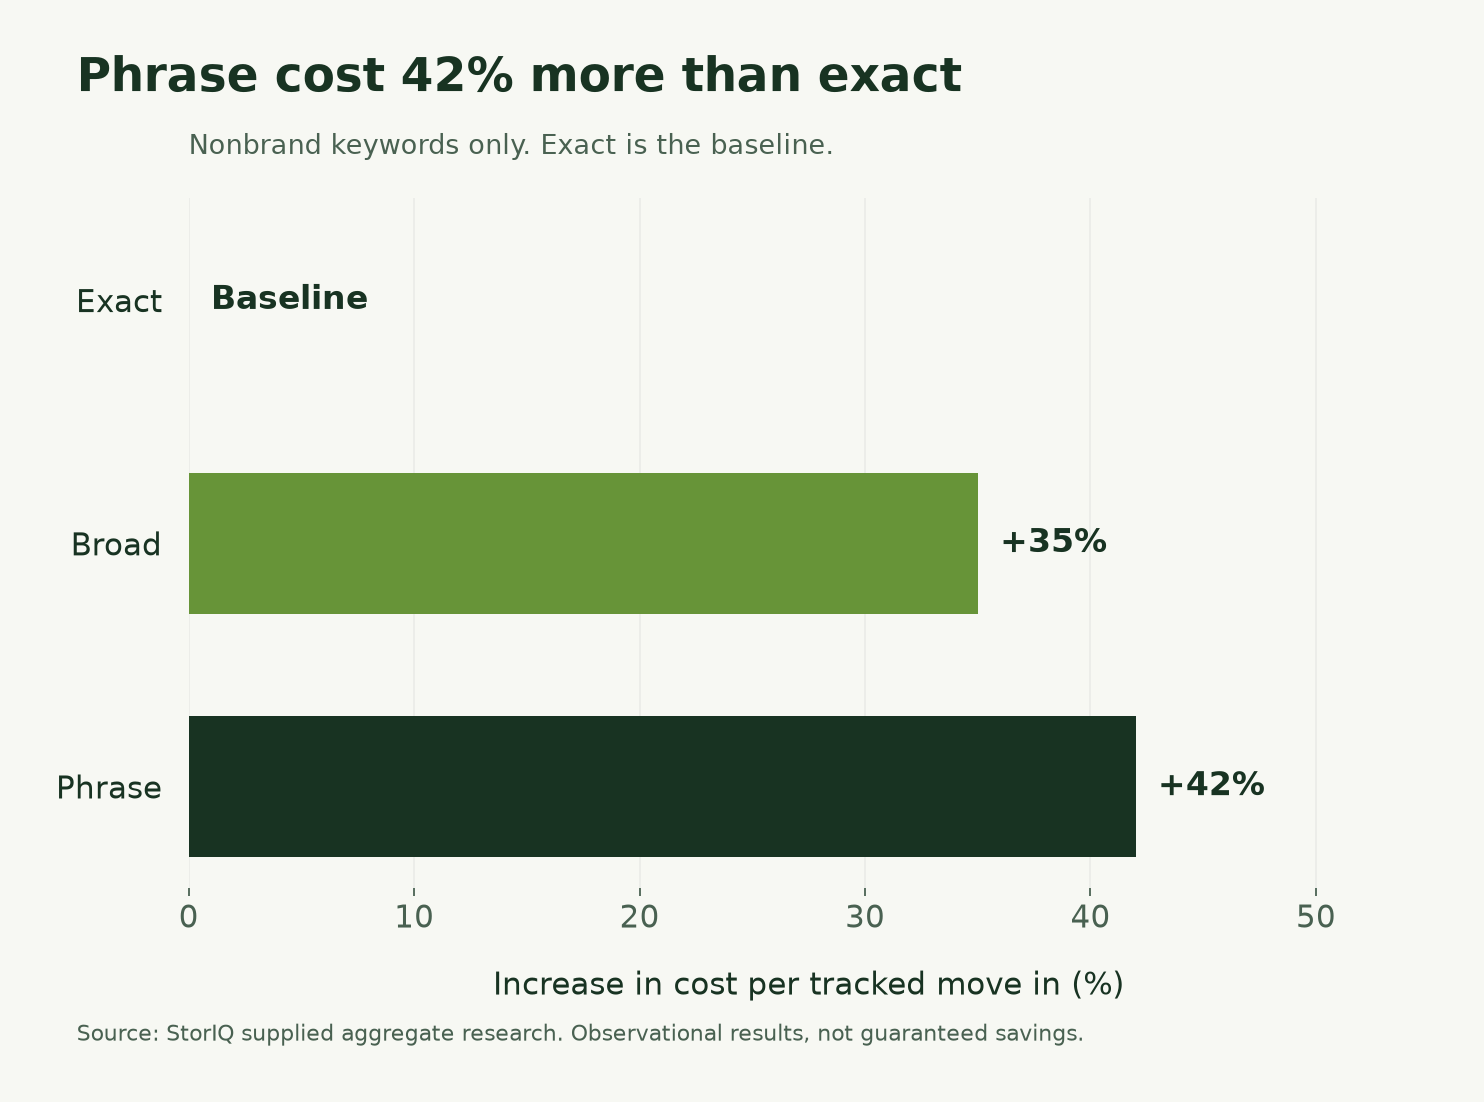
Across pooled nonbrand keywords, exact match had the lowest observed CPMI. Exact was indexed at 100, broad at 135, and phrase at 142.
| Match type | CPMI index | Difference from exact |
|---|---|---|
| Exact | 100 | Baseline |
| Broad | 135 | 35% higher |
| Phrase | 142 | 42% higher |
Within individual campaigns, exact beat phrase in about 63% of comparable cases where both had meaningful spend. The source summary did not specify the minimum spend threshold for that comparison.
Exact match is also not limited to literally identical wording. Google explains that exact match can include searches with the same meaning or intent. Google also describes broad match as a way to reach related searches and recommends using it with Smart Bidding. See Google’s current keyword matching options.
StorIQ’s result is observational, not a universal rule that exact will always outperform phrase or broad. Match type performance can depend on bidding, conversion signals, negatives, search terms, campaign structure, and local demand. Broad match can find useful incremental queries when the account supplies reliable outcome data, while exact can provide a more controlled starting point for proven intent.
Theme and match type matrix
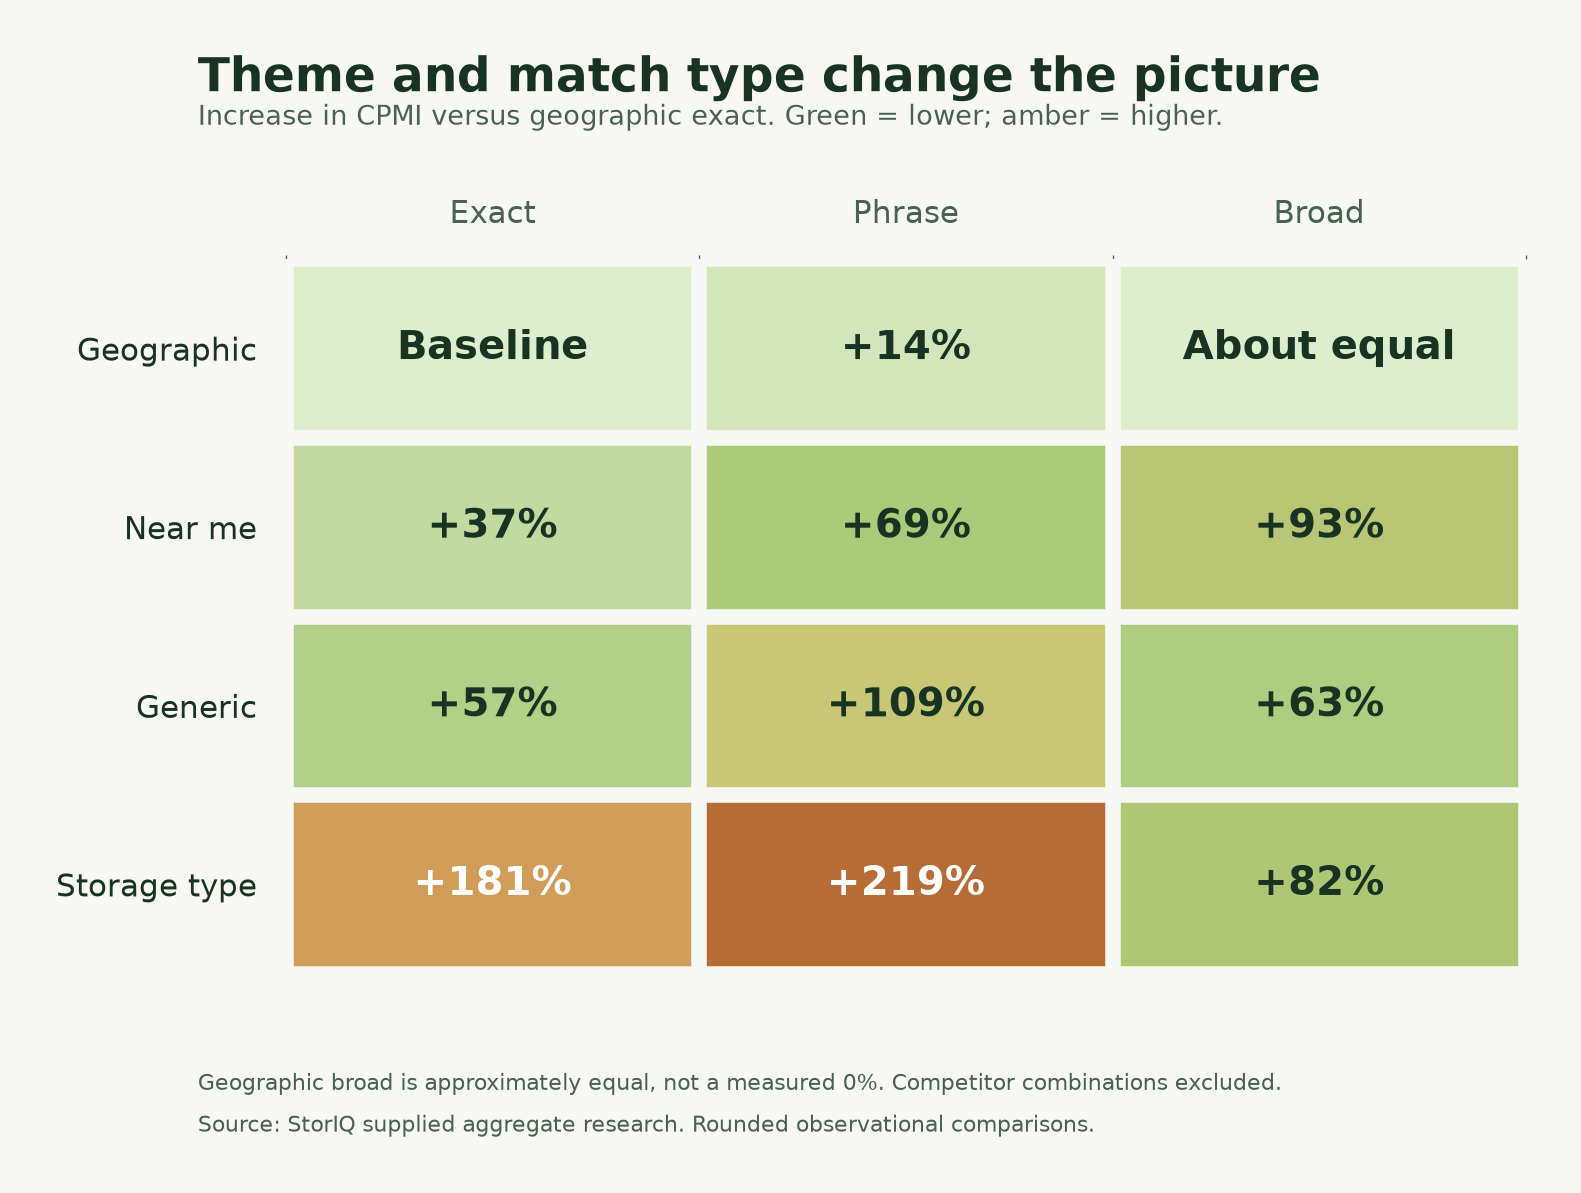
Theme and match type together revealed larger differences than either dimension alone. The matrix below uses geographic exact as the baseline.
| Keyword theme | Exact | Phrase | Broad |
|---|---|---|---|
| Geographic | Baseline | 14% higher | Approximately equal |
| Near me | 37% higher | 69% higher | 93% higher |
| Generic | 57% higher | 109% higher | 63% higher |
| Storage type | 181% higher | 219% higher | 82% higher |
Approximately equal is a directional description from the supplied summary. It should not be converted into a measured 0% difference.
Several patterns stand out:
- Geographic terms occupied the most efficient group of nonbrand combinations.
- Near me exact was more efficient than near me phrase or broad in the pooled results.
- Generic phrase was the most expensive generic combination.
- Storage type broad performed better than storage type exact or phrase, showing why an overall match type average should not become a rigid account rule.
- Competitor combinations were omitted because the smaller sample supports descriptive review only.
These comparisons identify places to investigate. They do not prove that changing a keyword’s match type will reproduce the observed difference.
What the research can and cannot say about proximity
The supplied research summary indicates a general directional advantage for nearer targeted markets, but this edition does not publish numerical distance statistics.
The geographic analysis used Google Ads targeted location reporting for overlapping radius targets. These are targeting records, not independently verified customer distance bands. A one mile target and a five mile target can overlap, so their performance should not be presented as separate groups of customers located one to two, two to three, or four to five miles away without validating how the reporting allocates that activity.
Google distinguishes targeted locations from matched locations and explains that geographic reports can reflect physical location or a location of interest. Its distance reports can also reflect the location that triggered an ad rather than a tenant’s precise physical location. See Google’s geographic performance documentation.
Operators can still compare nearer and farther targeted markets, but the results should be labeled according to what the platform actually reports. A reasonable process is to assess whether nearer areas produce efficient tracked move ins, then evaluate whether farther markets add enough volume or tenant value to justify their cost.
There is no universal radius that fits every facility. Density, competition, roads, inventory, product type, and local search demand can all affect the workable market. StorIQ’s Storage Demand Index and Market Competition tool can add market context, but neither replaces facility level advertising attribution.
A budget reallocation decision framework
The portfolio findings suggest that some accounts may benefit from comparing where money is spent with where tracked move ins occur. They do not promise that moving budget will cause the same result in another campaign.
Use four possible decisions:
| Decision | Evidence to review | Guardrail |
|---|---|---|
| Increase | Efficient CPMI, sufficient tracked outcomes, available inventory, and room to capture demand | Confirm that added spend can reach more qualified auctions |
| Hold | Acceptable CPMI but limited evidence or stable demand coverage | Continue collecting data without disrupting useful volume |
| Reduce | Persistently weak CPMI or spend without recorded move ins | Check attribution lag, tracking quality, and strategic inventory first |
| Investigate | Conflicting lead and move in signals, unusual search terms, or unclear geographic reporting | Diagnose the cause before changing budget |
A practical sequence is:
- Separate brand from nonbrand reporting.
- Compare spend, tracked move ins, and CPMI by facility, theme, match type, and targeted market.
- Flag areas with meaningful spend and no recorded move ins, while accounting for conversion delay.
- Identify efficient areas that may be constrained by budget or eligible demand.
- Check inventory, pricing, occupancy goals, and expected tenant value.
- Reallocate gradually and monitor total move in volume as well as CPMI.
Budget availability does not mean an efficient keyword can absorb unlimited spend. Search demand, ad rank, competition, and inventory can limit expansion. A broader self storage marketing plan should connect paid search decisions with occupancy and operational priorities.
Attribution quality determines how useful CPMI can be
A campaign can appear inefficient because it truly produced few tenants, or because its rental outcomes were not connected to the advertising record.
The supplied portfolio included variation in conversion names and definitions. Some campaigns with no recorded move ins were excluded. The source summary did not document one uniform verification or deduplication method.
Good reporting should distinguish among clicks, calls, forms, reservations, tracked move ins, and revenue. It should also document attribution windows, delayed rentals, call tracking coverage, account specific conversion definitions, and any known gaps.
This does not make the findings unusable. It limits how precisely they can be generalized. Improving move in attribution reporting gives operators a stronger basis for comparing campaigns. StorIQ’s Marketing Intelligence connects marketing reporting with facility outcomes so teams can investigate the full rental journey. Even well attributed outcomes do not by themselves prove incremental lift.
Landing page quality can also affect the path from click to move in. The self storage conversion checklist can help teams review the rental experience separately from media targeting.
Methodology and limitations
Data scope
This research summary covers more than $1 million in keyword spend across hundreds of self storage campaigns managed within a selected StorIQ portfolio. Detailed account and tenant sample counts are not published.
The portfolio is not a random or representative sample of the self storage industry. Its results should not be treated as universal market averages.
Outcome measure
The primary outcome was cost per tracked move in. Conversion actions included recorded rental outcomes, but definitions and naming varied by account. The source material does not establish uniform verification, deduplication, or incremental tenant measurement.
Exclusions
Some campaigns without recorded move ins were excluded from the analyzed comparisons. This can make the remaining portfolio look more efficient than all managed advertising activity and limits generalizability.
Keyword classification
Keywords were grouped as brand, geographic, near me, competitor, generic, or storage type. Phrase and broad keywords can trigger search terms that do not use the same language as the classified keyword.
Relative statistics
The report publishes indexed and relative CPMI differences rather than actual dollar costs. Percentages describe observed historical relationships in the selected portfolio. They are not forecasts or guaranteed savings.
Observational design
This was not a controlled experiment. Differences may reflect market competition, budgets, inventory, occupancy, pricing, promotions, bidding, account structure, brand awareness, attribution coverage, and other factors.
Geographic limitations
The geographic analysis used overlapping Google Ads radius targets across an overlapping set of Search and Performance Max campaigns. Those records are not verified physical customer distances or independently validated nonoverlapping bands. For that reason, this article does not publish a precise mile by mile acquisition cost chart or combine the geographic and keyword analyses as separate spending totals.
What operators should take from the data
The clearest portfolio pattern is that search intent matters. Geographic keywords were the strongest major nonbrand theme, near me contributed substantial volume, and generic and storage type terms received more spend relative to their share of tracked move ins.
Exact match led the pooled match type comparison, but the matrix shows that theme and match type interact. Broad was approximately equal to exact within the geographic theme and was the strongest storage type match in the supplied matrix. That is why portfolio averages should guide investigation rather than replace account specific analysis.
The next step is not to copy an average configuration. It is to connect each facility’s spend to its tracked move ins, inspect the weaker and stronger segments, and make controlled decisions that account for inventory and local demand.
Use StorIQ’s Visibility Grader to assess your facility’s organic local search visibility. It does not audit Google Ads campaigns. To discuss paid search attribution, CPMI reporting, and portfolio analysis, book a StorIQ demo. The PPC AI Agent focuses on advertising automation and rental attribution; our Google Ads software guide explains what to look for in that measurement layer.
Sources
- Supplied StorIQ original research summary covering selected managed campaign findings.
- Google Ads Help, About keyword matching options.
- Google Ads Help, About measuring geographic performance.
Frequently Asked Questions
What is cost per move in for self storage Google Ads?+
Which keyword theme produced the lowest nonbrand CPMI?+
Were brand keywords the best source of new tenants?+
Does exact match always outperform phrase and broad match?+
Should facilities remove near me keywords?+
Can Google Ads radius reports prove how far a tenant was from a facility?+
About the Author
John ReineschFounder, StorIQ
John is the founder and CEO of StorIQ, which handles Google Ads, local SEO, and attribution for self-storage operators across the US, Canada, and internationally. He also has ownership in three storage facilities across Texas, Pennsylvania, and Illinois, so he sees storage marketing from both the operator side and the agency side.